MarkdownReports
Type Less, Plot More. Create and auto-annotated and -saved (base) plots with very little code, and write (markdown) reports easily from your R scripts.
Project maintained by vertesy Hosted on GitHub Pages — Theme by mattgraham
![]()

[TOC]
MarkdownReports – Type Less, Plot More.
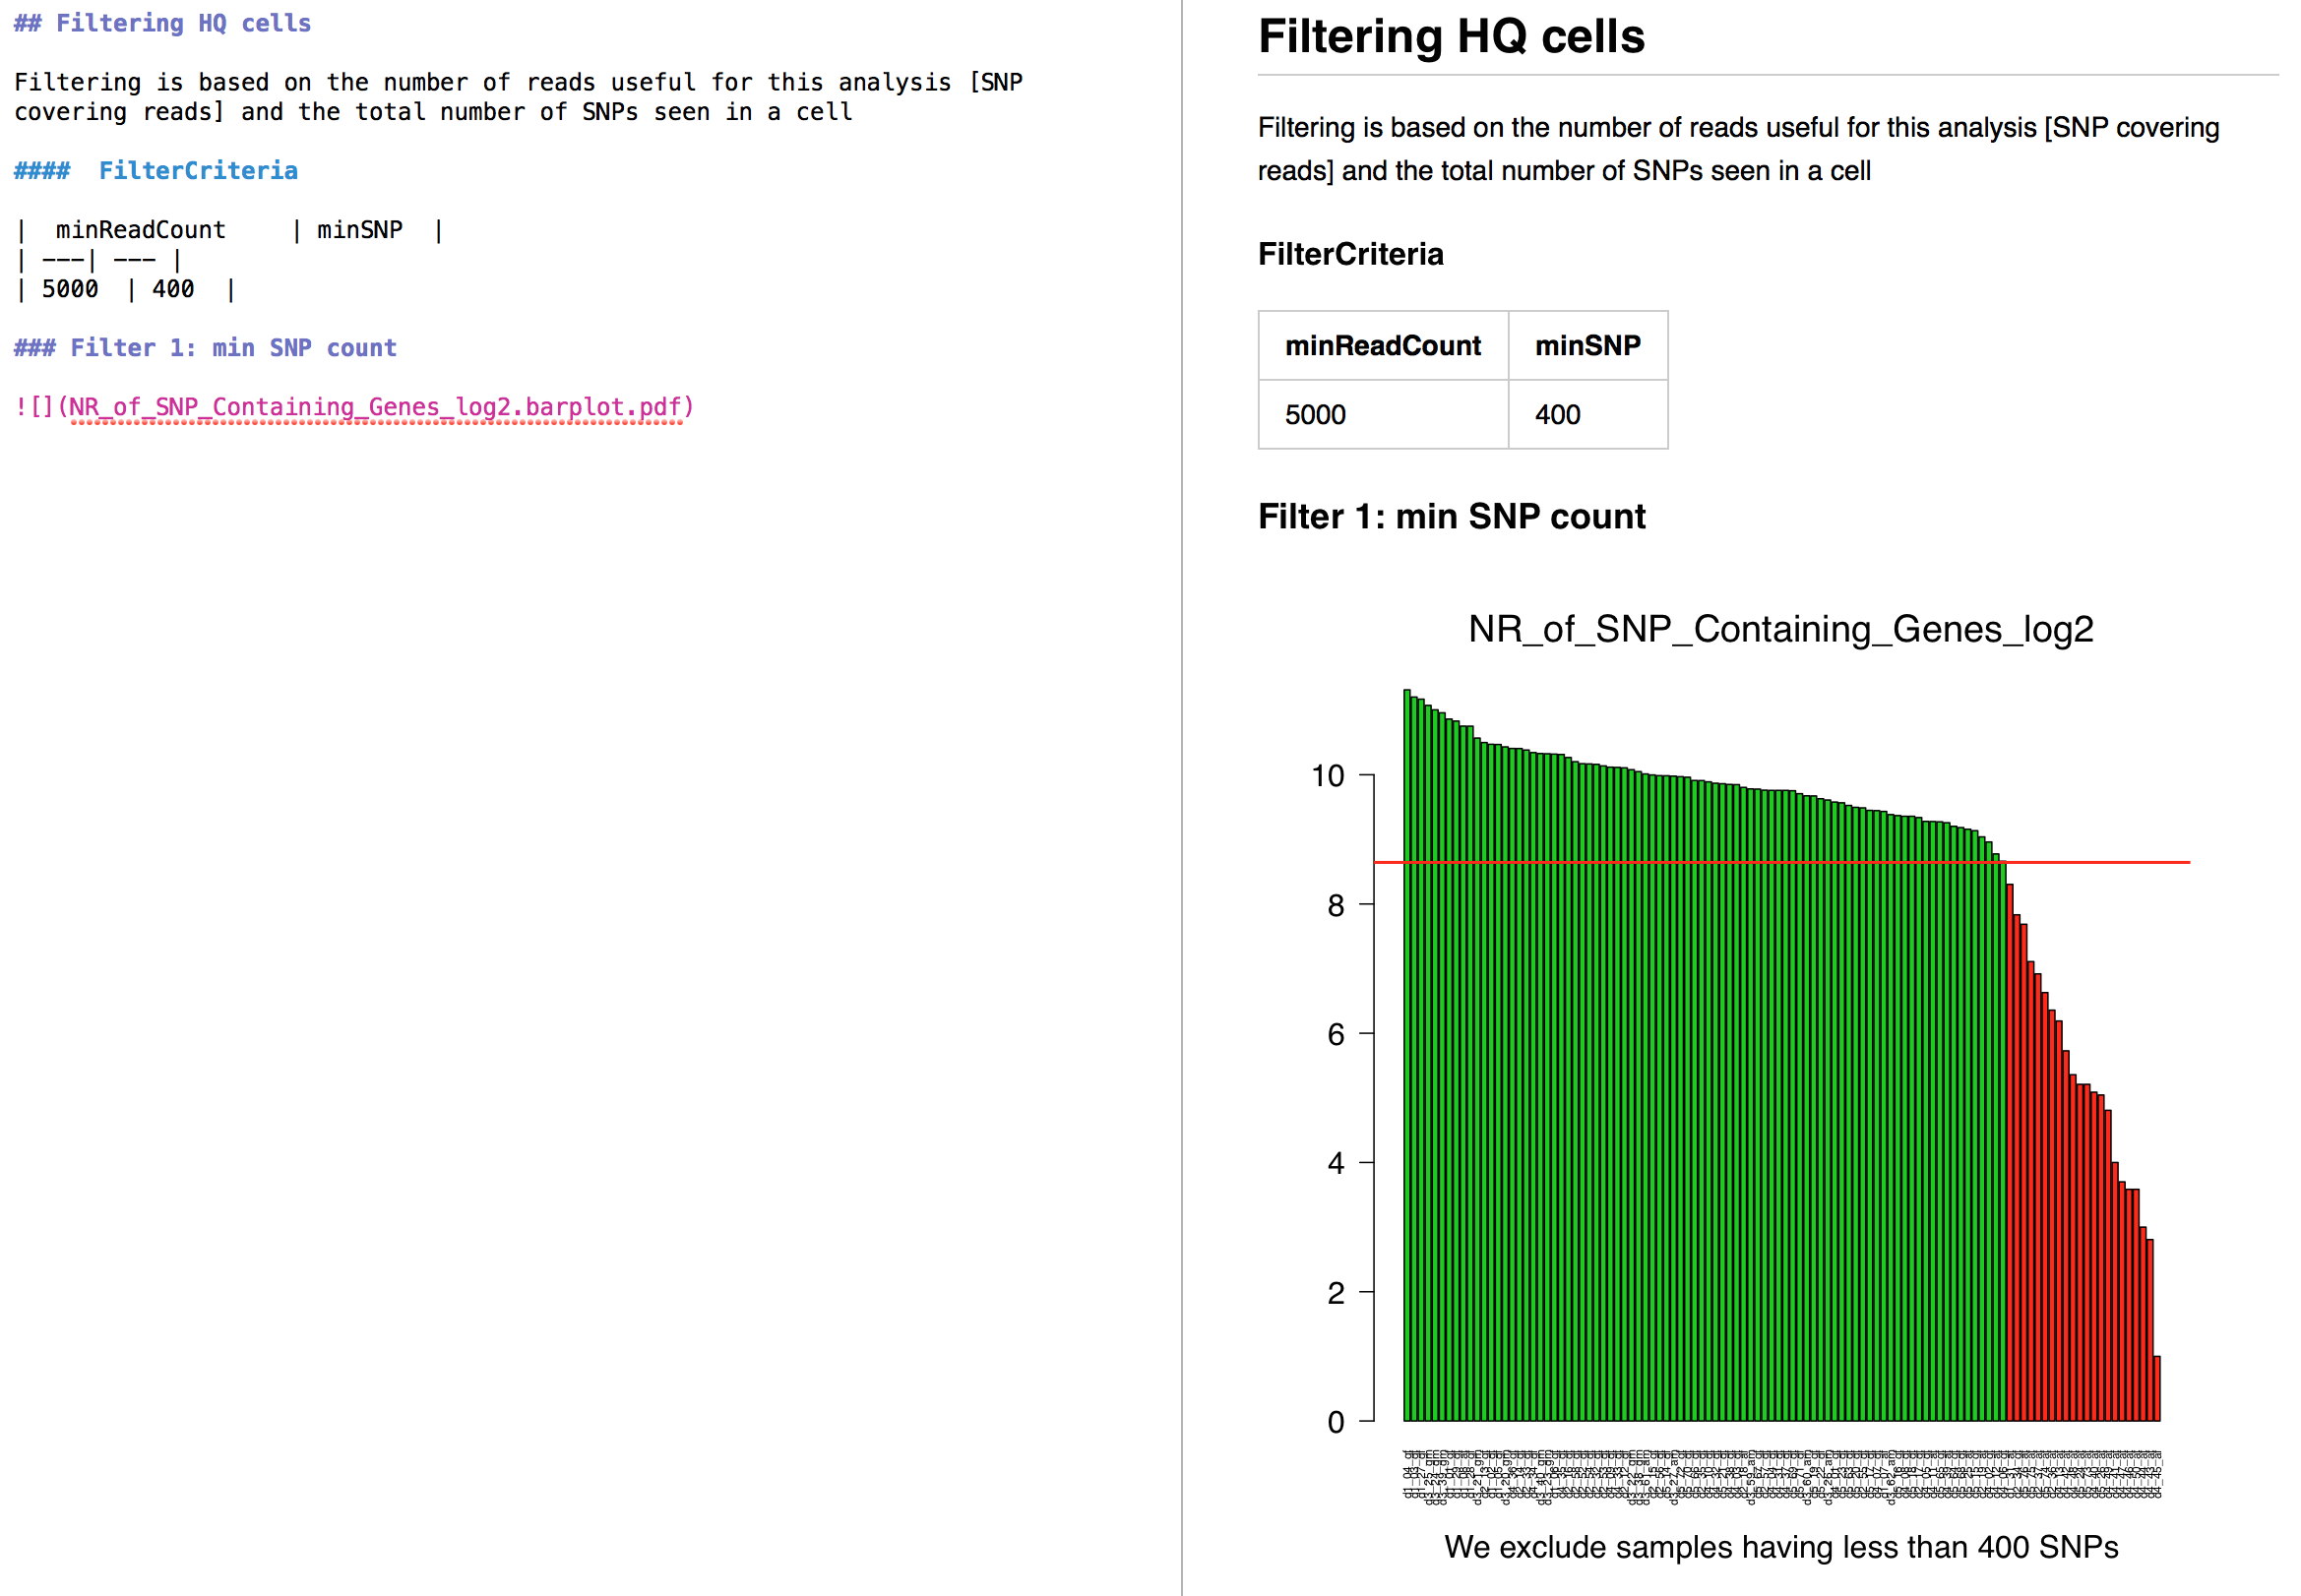
MarkdownReports allows you, to plot and save as .pdf/.png with minimal code. Labels, file-names, etc are auto-guessed from your data.
All the saved plots are automatically (but optionally) compiled into a markdown report document.
MarkdownReports conceptually differs from .Rmd / Rmarkdown notebooks, in that it keeps code and reports separate:
- Plain code scripts are easier to develop and maintain.
- Plain reports are focusing on results and data, which makes presentation of the results easier.
- Yet the two are directly linked, and the report is automatically updated.
MarkdownReports depends on:
… and provides functions for
What is MarkdownReports?
MarkdownReports is a set of R functions that allows you to generate precise figures easily, and create clean reports in markdown language about what you just discovered with your analysis script. It helps you to:
- Create scientifically accurate figures and save them automatically as vector graphic (.pdf) or raster (.png), that you can use from presentation to posters anywhere.
- Note down your findings easily in a clear and nicely formatted way, parsed from your variables into english sentences.
- Link & display your figures automatically inside your report, right there where they are needed.
- Version your findings, annotating which parameters were used to reach certain results.
- Share your report with others via email, Github or a personal website.
Why did I make it & why you might like it too?
I do exploratory data analysis as a daily routine, and I have constant interaction with all sorts of people: supervisors, collaborators, colleagues, etc.
I often have to…
- Make figures quickly.
- …write emails summarising the results (text & figures) of the last few days.
- …find results from a couple of months back, with all tiny details (parameters used, etc).
- …assemble each step I did that day into a logical story line, that others can understand at first glimpse, e.g.: I observed X; I controlled for Y; Hypothesised explanation A; Falsified it; Came up with explanation B; Tested & proven it…
For all of the above, my solution is MarkdownReports. I think it’s better than other solutions I found. Many of those like to combine source code with results, and many are too complex to use. Most people I interact with are not interested in the source code, but are very keen on seeing my results from all possible angles and ask detailed questions about the analysis.
Make figures quickly
- The philosophy of the package is to type little (but draw and save correctly annotated figures).
- Instead of specifying everything in lengthy commands (ala ggplot), plotting functions make use of sensible defaults (such as meaningful variable names, row names, column names, etc.)
- Both display and save each plot as
.pdfdynamically named (from variable names) - Examples:
wboxplot()takes a list, used thevariable nameto set the filename and the title,list element namesto set the x-axis labels, saves the file asvariable name.pdf(or.png). - All plot functions start with w, followed by the base plot name, such as
wplot(),wbarplot(),wpie(),wboxplot(),but alsowvenn(),wvioplot_list(),wviostripchart_list(). - See more under: Discover 4 Yourself! (Below)
Write a report on the fly
Differences to Rmarkdown:
- It is intended for a different purpose:
- MarkdownReports is written for rapid progress reporting, whereas
- Rmarkdown is perfect for writing analytical explanations on “how do you analyse this?” and writing longer books.
- Much faster to report in MarkdownReports:
- You parse your report on the fly from directly your working script. (
- In Rmarkdown you would make a separate cleaned-up a script, that you then knit as a separate step.
- No hassle of executing computation in isolated code-blocks (and importing all relevant variables there). Your code is also a lot easier to follow because it is not split up in blocks.
Where does MarkdownReports stand out?
- Pure markdown output, compatible, simple and elegant layout.
- Integration of text, figures and tables with very few lines of extra code.
- Easy generation of precise figures (axis labels, coloring by filtering etc), a big enhancement over base graphics, while maintaining 90% of its syntax.
- Plots are both displayed and saved as a vector graphic (pdf), making it scalable for presentations, posters, etc
- Traceable results:
- PDF plots are labeled by the script generating them in the title field:
Filter.and.Stats by ExpressionAnalysis.R - The report file is automatically named after the R-script, and date so that it is linked to the source code that generated it.
- Simply log all used settings into a markdown table by the
log_settings_MarkDown()and the ` md.LogSettingsFromList()`functions.
- PDF plots are labeled by the script generating them in the title field:
- it natively exports tables from R to Markdown
- A timestamped subdirectory is created that you can backup once satisfied with your results.
- Github Compatibility:The generated report is easy to share on a GitHub wiki.
- It parses and writes full sentences to the report from operations you perform.
- For instance filter on gene expression level:
GeneExpression = rnorm(2000, mean = 100, sd=50);
MinExpression=125
PASS=filter_HP(GeneExpression, threshold = MinExpression)
and your report will have the summary: 30.7 % or 614 of 2000 entries in GeneExpression fall above a threshold value of: 125.
- For instance filter on gene expression level:
- Enhanced productivity features:
- Error bars are handled by
wbarplot()natively. - Add an labels to bars in a barplot by
barplot_label(). - Native 2-D error bars in scatterplots
wplot(). - Easy colour schemes by
wcolorize()frombase,gplotsandRcolorbrewer. - Add legends with the super short command
wlegend(colannot$categ), defining colors named after the categories of your data.- It is automatically created by
colannot = wcolorize(your.annotation, ReturnCategoriesToo = T), which you (can) anyways use to colour data points on, say, your scatterplot.
- It is automatically created by
- Show filtering results with a one liner:
whist(rnorm(1000), vline = .5, filtercol = T).
- Error bars are handled by
- Although currently plotting is implemented as an enhanced base graphic, but the concept could easily be extended to ggplot.
Yet, you can still use ggplot, because you equally well save and report them by either
wplot_save_this()or thepdfA4plot_on()andpdfA4plot_off()functions. -
It is all achieved in ~ 1600 lines of well documented code compiled into a proper R-package.
Installation
You can install all of them directly from GitHub via devtools with one R command:
# install.packages("devtools"); # If you don't have it.
require("devtools")

# Install dependencies
devtools::install_github(repo = "vertesy/Stringendo", ref = "main", upgrade = F)
devtools::install_github(repo = "vertesy/CodeAndRoll2", ref = "main", upgrade = F)
devtools::install_github(repo = "vertesy/ReadWriter", ref = "main", upgrade = F)
devtools::install_github(repo = "vertesy/MarkdownHelpers", ref = "main", upgrade = F)

# Install MarkdownReports
devtools::install_github(repo = "vertesy/Markdownreports", ref = "main", upgrade = F)
…then simply load the package:
require("MarkdownReports")
Alternatively, you simply source it from the web. This way function help will not work, and you will have no local copy of the code on your hard drive.
source("https://raw.githubusercontent.com/vertesy/MarkdownReports/master/R/MarkdownReports.R")
Troubleshooting
If you encounter a bug, something doesn’t work or unclear, please let me know by raising an issue on MarkdownReports – Please check if it has been asked.
Discover 4 Yourself!
- Check out the wiki!
- Check the example:
- Check out a dummy R script and the
- MarkDown report it generates inside this GitHub Repo.
- Browse the code of the functions.
Learn about the markdown format
- See the power and simplicity of markdown format explained on Github
- Checkout some cool markdown editors, like MOU, Typora, or markdownpad.
- See how these markdown reports are rendered:
Function relationships
(of connected functions)
flowchart LR

  wviostripchart_list(wviostripchart_list) --> ww.dev.copy(ww.dev.copy)
  wvioplot_list(wvioplot_list) --> ww.dev.copy(ww.dev.copy)
  wstripchart_list(wstripchart_list) --> ww.dev.copy(ww.dev.copy)
  wstripchart(wstripchart) --> ww.dev.copy(ww.dev.copy)
  wscatter.fill(wscatter.fill) --> ww.dev.copy(ww.dev.copy)
  wplot(wplot) --> ww.dev.copy(ww.dev.copy)
  wpie(wpie) --> ww.dev.copy(ww.dev.copy)
  wlegend.label(wlegend.label) --> wplot_save_this(wplot_save_this)
  wlegend(wlegend) --> wplot_save_this(wplot_save_this)
  whist_dfCol(whist_dfCol) --> ww.dev.copy(ww.dev.copy)
  whist(whist) --> ww.dev.copy(ww.dev.copy)
  wboxplot(wboxplot) --> ww.dev.copy(ww.dev.copy)
  wbarplot_dfCol(wbarplot_dfCol) --> ww.dev.copy(ww.dev.copy)
  wbarplot(wbarplot) --> ww.dev.copy(ww.dev.copy)
  wLinRegression(wLinRegression) --> superscript_in_plots(superscript_in_plots)
  wLinRegression(wLinRegression) --> wplot_save_this(wplot_save_this)
  wplot_save_this(wplot_save_this) --> ww.dev.copy(ww.dev.copy)
  barplot_label(barplot_label) --> wplot_save_this(wplot_save_this)
subgraph SubGraphOne

end
created by convert_igraph_to_mermaid()
List of Functions in MarkdownReports (31)
Updated: 2024/10/24 15:57
-
1
setup_MarkdownReports()Setup Markdown Reports. Initializes the markdown report file and the output directory. This function creates a subdirectory in “OutDir”, named with the script name and the modification time. It also defines the “path_of_report” variable used by all log-writing and wplot functions.
-
2
create_set_OutDir()create_set_OutDir. Create or set the output directory of the script, and set the “OutDir” variable that is used by all ~wplot functions.
-
3
create_set_SubDir()Create_set_SubDir. Create or set the output directory of the script, and set the “NewOutDir” variable that is used by all ~wplot functions. Opening pair of the create_set_Original_OutDir function.
-
4
create_set_Original_OutDir()create_set_Original_OutDir. Closing pair of the create_set_SubDir function. Call when chaning back to the main dir. Set the output directory of the script, and set the “NewOutDir” variable that is used by all ~wplot functions.
-
5
continue_logging_markdown()continue_logging_markdown. Continue writing to an existing report file.
-
6
check_OutDir()Compare Current Working Directory with OutDir. This function checks if the current working directory is the same as a specified directory (OutDir). If they do not match, it prints both directories to the screen.
-
7
wplot_save_this()wplot_save_this. Save the currently active graphic device (for complicated plots). Insert links to your markdown report, set by “path_of_report”. Name the file by naming the variable!
-
8
wplot_save_pheatmap()wplot_save_pheatmap. Save pheatmap object. Modified from: https://stackoverflow.com/questions/43051525/how-to-draw-pheatmap-plot-to-screen-and-also-save-to-file
-
9
wplot()wplot. Create and save scatter plots as .pdf, in “OutDir”. If mdlink = TRUE, it inserts a .pdf and a .png link in the markdown report, set by “path_of_report”. The .png version is not created, only the link is put in place, not to overwrite previous versions. The .png version is not created, only the link is put in place. You can add 2D error bars around the dots, or add lines (ablines) to your plot, by setting “abline” argument to = FALSE (no line, default), “h” (horizontal, further specified by a = y-offset), “v” (vertical, further specified by a = x-offset), “ab” (line with an angle, further specified by a = offset, b = slope).
-
10
wscatter.fill()wscatter.fill. A scatterplot with color gradient and color legend. Modified from: http://stackoverflow.com/questions/20127282/r-color-scatterplot-points-by-col-value-with-legend
-
11
wbarplot()wbarplot. Create and save bar plots as .pdf, in “OutDir”. If mdlink = TRUE, it inserts a .pdf and a .png link in the markdown report, set by “path_of_report”. The .png version is not created, only the link is put in place, not to overwrite previous versions.
-
12
whist()whist. Create and save histograms as .pdf, in “OutDir”. If mdlink = TRUE, it inserts a .pdf and a .png link in the markdown report, set by “path_of_report”. The .png version is not created, only the link is put in place, not to overwrite previous versions. Name the file by naming the variable! Cannot be used with dynamically called variables [e.g. call vectors within a loop]. “filtercol” assumes >= coloring!
-
13
wboxplot()wboxplot. Create and save box plots as .pdf, in “OutDir”. If mdlink = TRUE, it inserts a .pdf and a .png link in the markdown report, set by “path_of_report”. The .png version is not created, only the link is put in place, not to overwrite previous versions.
-
14
wpie()wpie. Create and save pie charts as .pdf, in “OutDir”. If mdlink = TRUE, it inserts a .pdf and a .png link in the markdown report, set by “path_of_report”. The .png version is not created, only the link is put in place, not to overwrite previous versions.
-
15
wstripchart()wstripchart. Create and save strip charts as .pdf, in “OutDir”. If mdlink = TRUE, it inserts a .pdf and a .png link in the markdown report, set by “path_of_report”. The .png version is not created, only the link is put in place, not to overwrite previous versions.
-
16
wstripchart_list()wstripchart_list. Create and save stripcharts from a list as .pdf, in “OutDir”. This version allows individual coloring of each data point, by a color-list of the same dimension. If mdlink = TRUE, it inserts a .pdf and a .png link in the markdown report, set by “path_of_report”. The .png version is not created, only the link is put in place, not to overwrite previous versions.
-
17
wvioplot_list()wvioplot_list. Create and save violin plots as .pdf, in “OutDir”. It requires (and calls) “vioplot” package. If mdlink = TRUE, it inserts a .pdf and a .png link in the markdown report, set by “path_of_report”. The .png version is not created, only the link is put in place, not to overwrite previous versions.
-
18
wviostripchart_list()wviostripchart_list. Create and save violin plots as .pdf, in “OutDir”. It requires (and calls) “vioplot” package. If mdlink = TRUE, it inserts a .pdf and a .png link in the markdown report, set by “path_of_report”. The .png version is not created, only the link is put in place, not to overwrite previous versions.
-
19
wvenn()wvenn. Save Venn diagrams. Unlike other ~vplot functions, this saves directly into a .png and it does not use the dev.copy2pdf() function.
-
20
wbarplot_dfCol()wbarplot_dfCol. wbarplot for a column of a data frame.
-
21
whist_dfCol()whist_dfCol. Use this version of whist() if you iterate over columns or rows of a data frame. You can name the file by naming the variable. Cannot be used with dynamically called variables (e.g. call vectors within a loop).
-
22
pdfA4plot_on()pdfA4plot_on. Create A4 PDFs to plot multiple subplots in one file
-
23
pdfA4plot_on.layout()pdfA4plot_on.layout. Create A4 PDFs to plot multiple subplots in one file with custom numbers of columns in each row. Fancy layout version of pdfA4plot_on()
-
24
pdfA4plot_off()pdfA4plot_off. The pair of the “pdfA4plot_on()” function; to finish plotting in the A4 pdf. @importFrom clipr write_clip @examples pdfA4plot_on.layout(plotname = “MyA4_w_layout”) hist(rnorm(100)) hist(-rnorm(100)) hist(10 + rnorm(100)) pdfA4plot_off()
-
25
error_bar()error_bar. Put error bars on top of your bar plots. This functionality is now integrated into MarkdownReporter’s wbarplot() function
-
26
wlegend()wlegend. Quickly add a legend to an existing plot, and save the plot immediately.
-
27
wlegend.label()wlegend.label. Quickly add a “text only” legend without a filled color box. to an existing plot, and save the plot immediately. Never inserts an mdlink.
-
28
barplot_label()barplot_label. Add extra labels to your bar plots at the top or the base.
-
29
wLinRegression()wLinRegression. Add linear regression, and descriptors to line to your scatter plot. Provide the same dataframe as you provided to wplot() before you called this function
-
30
subscript_in_plots()subscript_in_plots. Returns a formatted string that you feed to main, xlab or ylab parameters of a plot Create an expression with subscript for axis labels. Parsed when provided to xlab or ylab of a function.
-
31
superscript_in_plots()superscript_in_plots. Returns a formatted string that you feed to main, xlab or ylab parameters of a plot Create an expression with superscript for axis labels. Parsed when provided to xlab or ylab of a function.
Cite it via its Digital Object Identifier (DOI):
![]()
Abel Vertesy. (2017, October 17). MarkdownReports: An R function library to create scientific figures and markdown reports easily. (Version v2.9.5). Zenodo. http://doi.org/10.5281/zenodo.594683
MarkdownReports is a project of @vertesy.